


Charts Grade: C
Overview:
In our original review of the Firstrade charts we knocked the platform for having poor aesthetics and broken features. Firstrade has made some much warranted improvements to their charts of late. Saving chart settings has been much improved and a few broken features, such as earnings event indicators, are now fixed. Candlesticks still often mash together or are too thin depending on the chart time line which is a bummer. Comparison charts are still limited to two stocks at a time, a lingering outdated restriction. Finally, chart sizes are not large enough for those with very high resolution monitors. The Firstrade charts are improved but are only average when compared to the competition.
Details:
Here is a basic one year mountain chart for Lockheed Martin (LMT) with the volume shown below the chart (click on images for larger views):
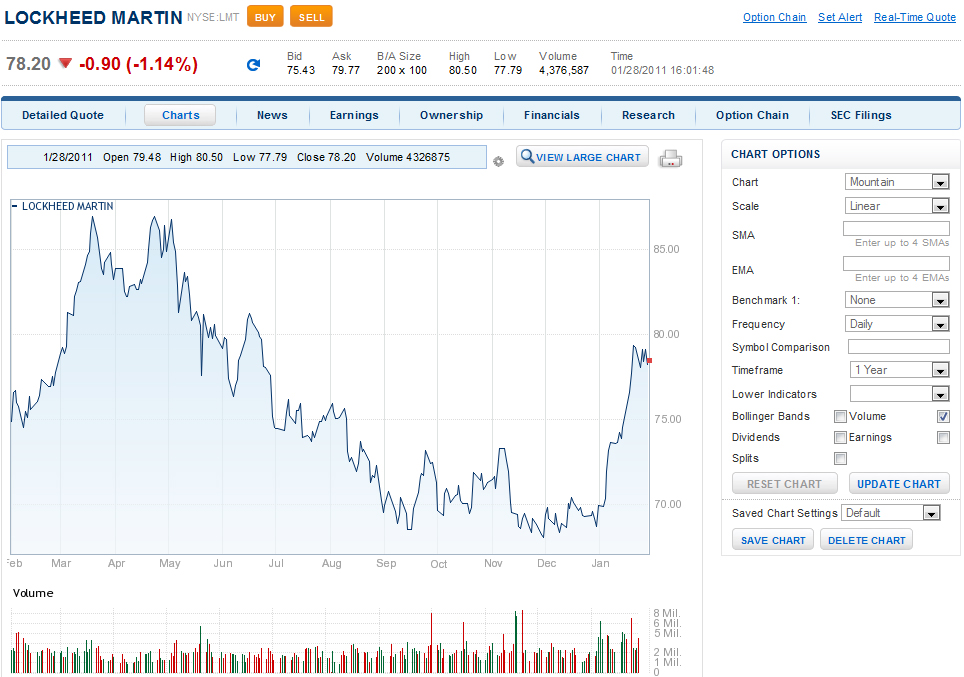
Clicking on the View Large Chart link brings up a new browser window which, strangely enough, contains a chart that is the exact same size. For those of us with high resolution monitors it would be nice to have larger charts.
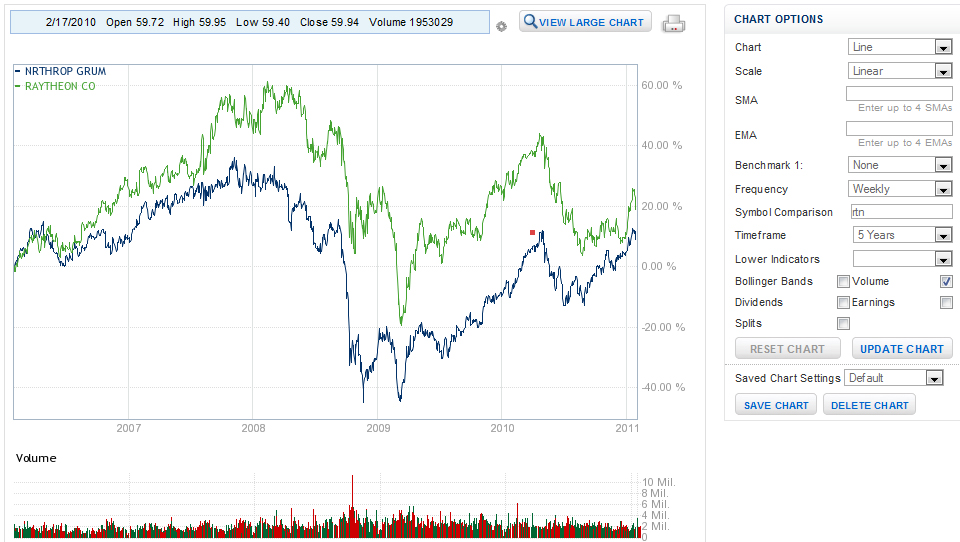
Next up, let's look at a five year chart comparing Lockheed Martin, Northrop Grumman and Raytheon. We would have liked to include other stocks in this comparison but the Firstrade charts only allow for the comparison of two stocks at a time:
Next we brought up a 3 year candlestick for Northrop Grumman (NOC) showing the 100 day moving average and dividend and earnings events:
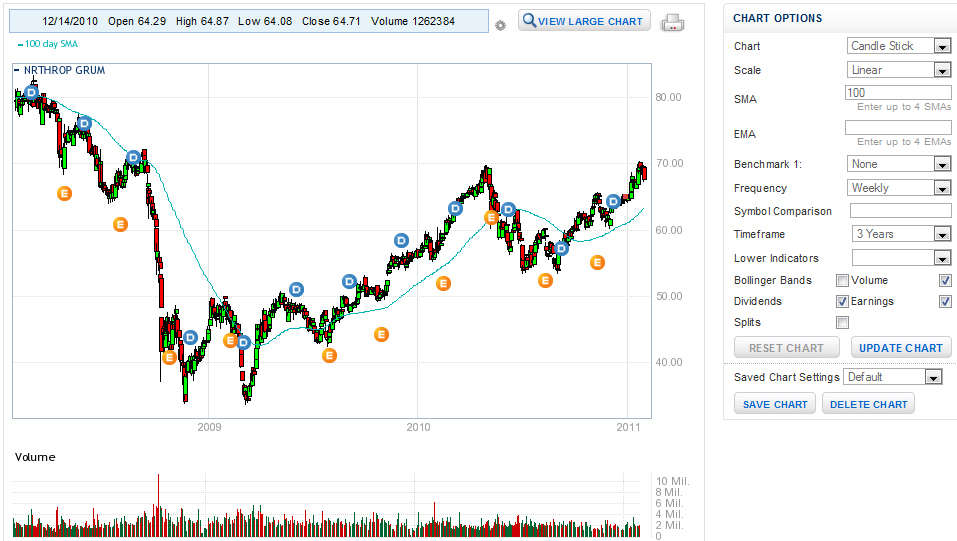
In the above chart you will also notice that the candlesticks are all mashed together. In other charts that we tested the candlesticks were almost always too wide or too narrow with no middle ground. This can be quite frustrating.
Going back to Lockheed Martin, we loaded a three month candlestick chart with bollinger bands (upper indicator) and momentum and relative strength indicators (bottom). In total there are 15 lower indicators. We removed the lower volume indicator but the two new lower indicators did not shift up in our window, an annoying design oversight:
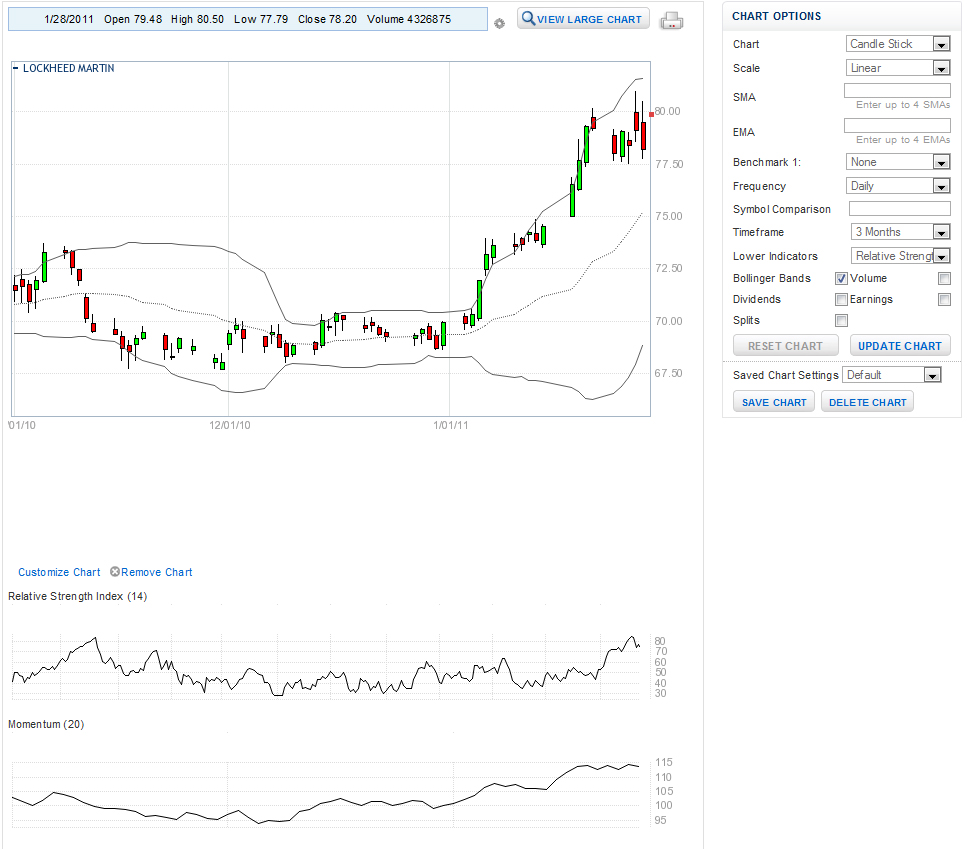
Chart settings can be saved by clicking on the Save Chart button. A dialog box will appear prompting the user for a name. Once the settings are saved, they will appear in the Saved Chart Settings drop down box. This is a simple yet useful and often overlooked feature of broker charts.
Related Articles:
Firstrade Review
Firstrade Stock Trading
Firstrade Options Trading
Firstrade Research Tools
Firstrade iPhone App