
Charts Grade: B
Overview:
TradeKing has very nice charts. Charts are large and visually appealing. There are over twenty technical and fundamental indicators available, which is a bit less than some of the top competitors. Having the ability to save chart settings and draw trendlines are nice features to have.
Details:
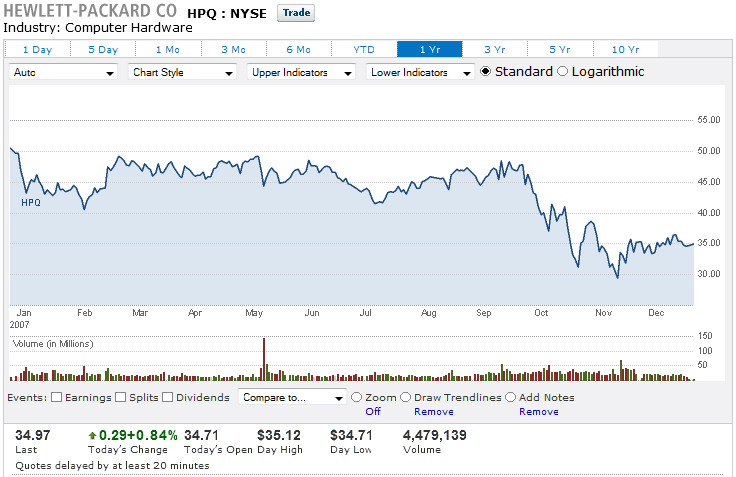
Basic 1 year chart for Hewlett-Packard (HPQ) (click on images for larger views):
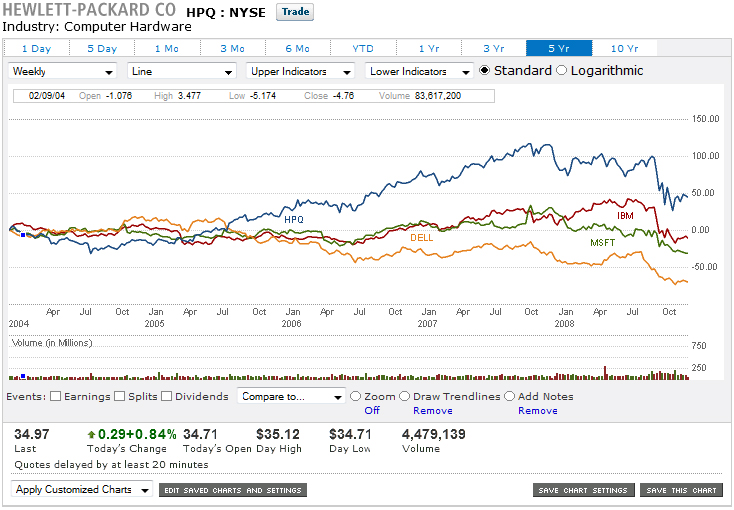
5 year chart comparing HPQ, DELL, MSFT and IBM:
HPQ 5 year chart with dividends, 52 week moving average and money flow:
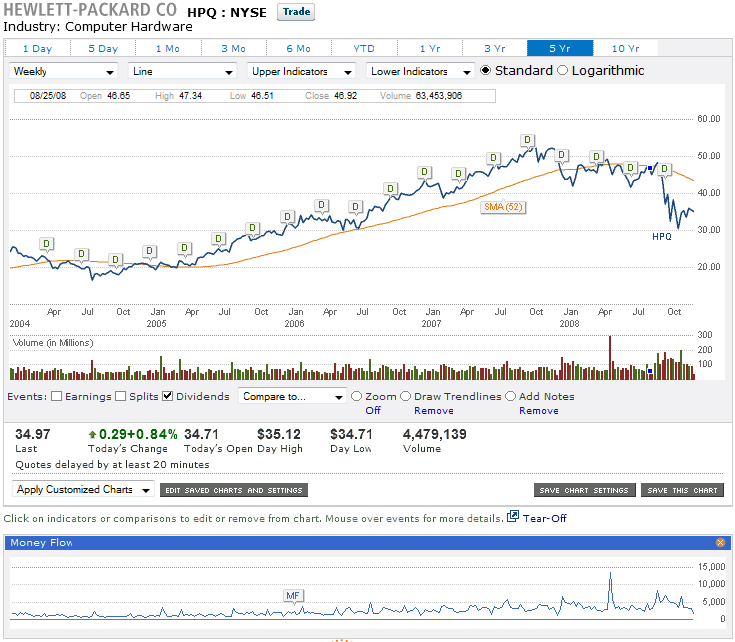
The lower indicators (money flow, in the example above) are shown below the stock price data and other options menus. It would be much nicer if these lower indicators were shown above this information, and just below the volume data.
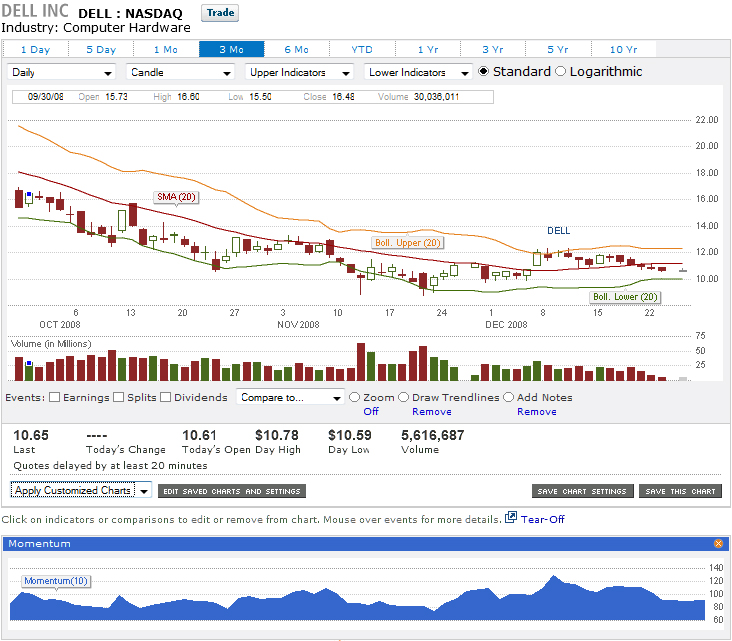
TradeKing allows users to save chart settings. For example, I created a candlestick chart with a time interval of 3 months, bollinger bands, 20 day moving average and momentum. When viewing DELL, I clicked on the Apply Customized Chart drop down menu and selected my saved chart to display:
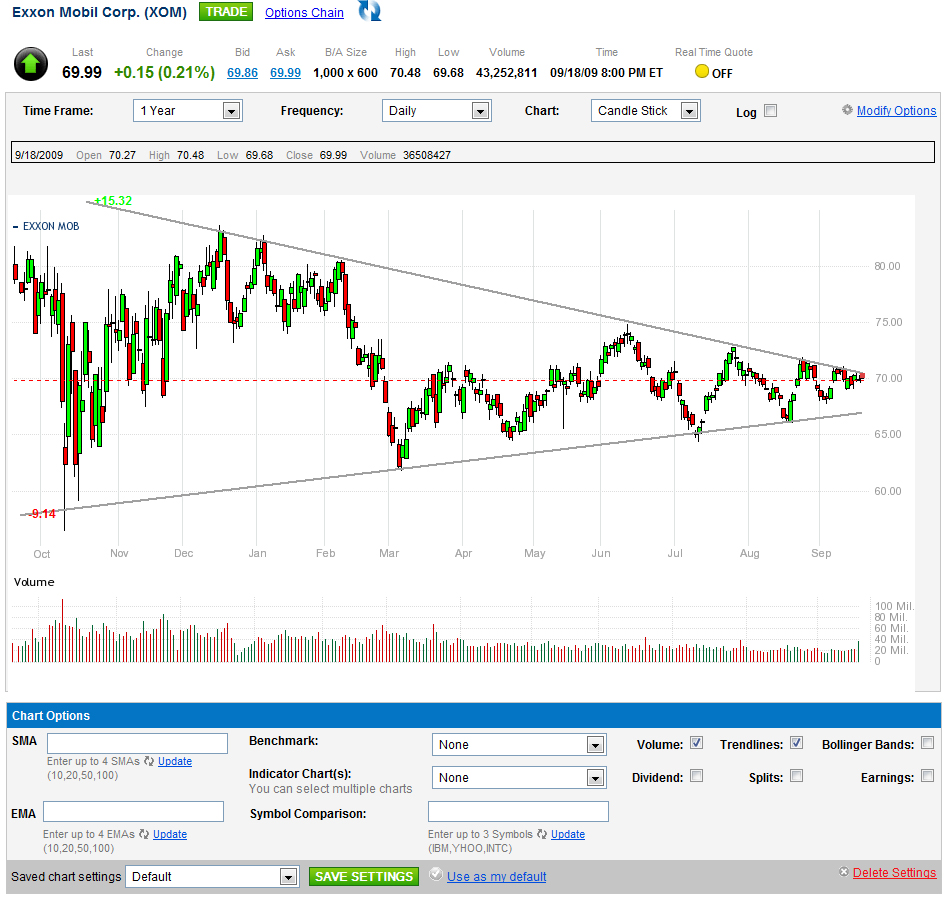
Finally, the trendline tool can be used to effectively draw channels and lines of support and resistance. Here I highlighted a very interesting wedge pattern that will soon complete for Exxon Mobile (XOM):
Related Articles:
TradeKing Review
TradeKing Stock Trading
TradeKing Options Trading
TradeKing Research Tools
TradeKing iPhone App